Feature
Tabulation engine
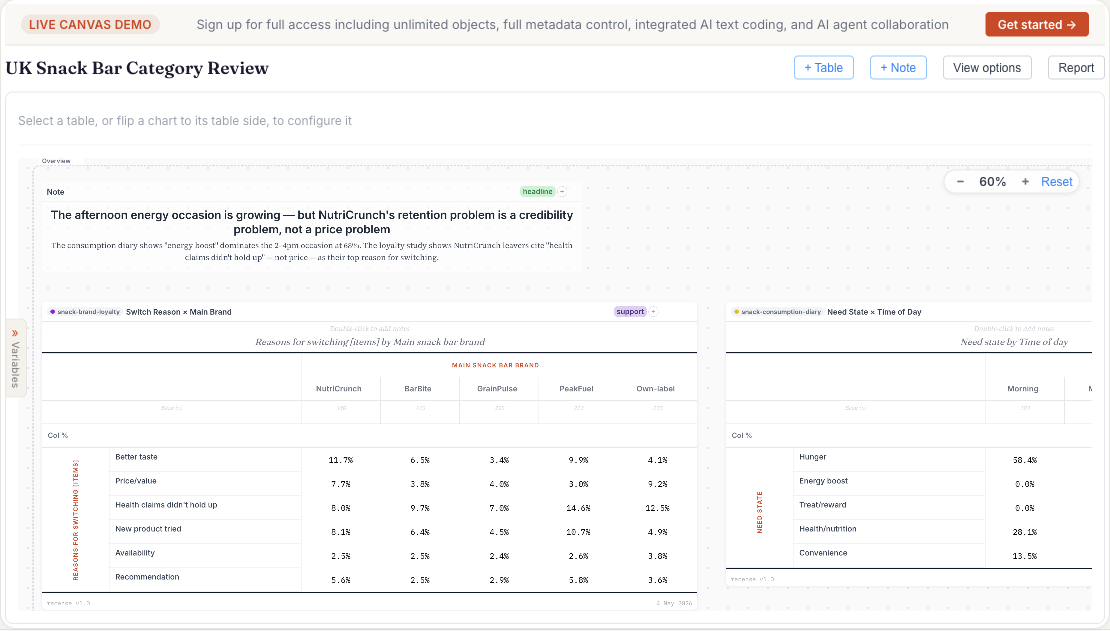
A purpose-built crosstab engine for survey data. Compiled from Rust to WebAssembly, running in your browser. Tables that took seconds on a server return in milliseconds on a laptop.
Drag, drop, and the table is there
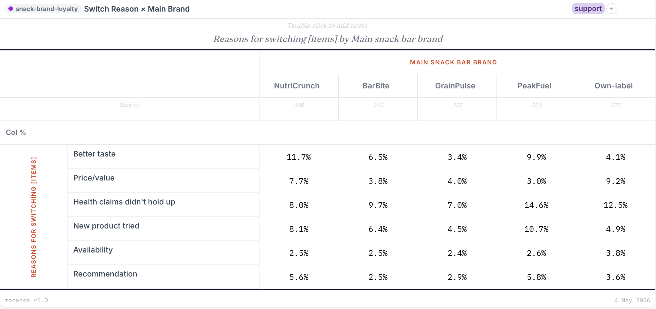
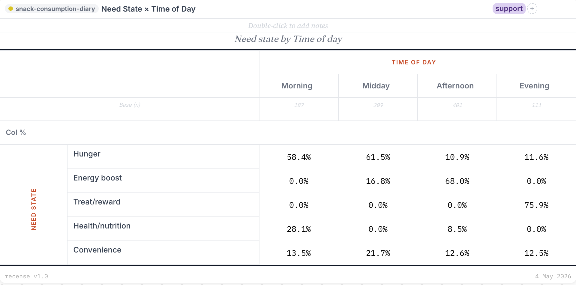
Drag a variable to rows, another to columns, and the table is on the screen. Add measures (count, percent, mean, weighted base), apply filters, switch percentaging direction, change weight schemes — each edit recomputes immediately. There's no server round-trip in the way, because there is no server in the way.
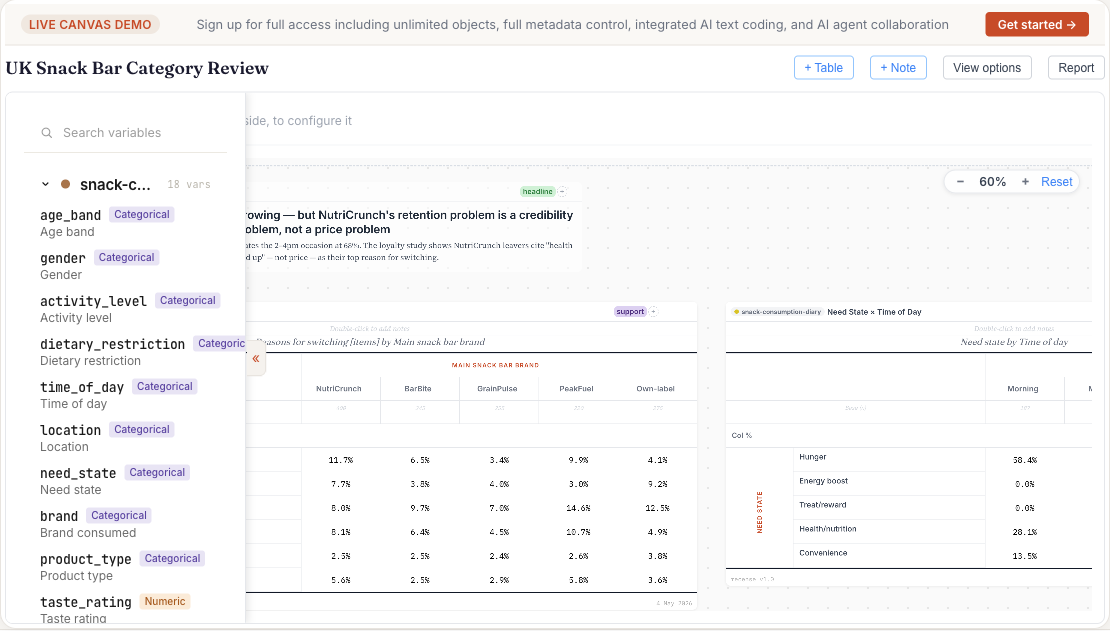
What it understands about survey data
- Variable types out of the box. Categorical, numeric, Likert, multiple-response (sets and grids), date, currency, free text. Type inference runs on import; you can override anywhere.
- Missing-value semantics. SPSS user-defined missing codes, system-missing, and explicit "not asked" routing are honoured throughout. Bases are calculated correctly without manual filtering.
- Weighting. Apply per-table weights from variables in the dataset, or define new weighting schemes (RIM, post-strat) from the canvas. Effective base is reported alongside unweighted count.
Derived variables and formula cells
- Significance testing. Pairwise z-tests across columns, with effective N for weighted data. Sig levels are configurable per table.
- Derived variables. Build new categories, recodes, and groupings without leaving the canvas. Derivations are first-class — they recompute when source data changes.
- Formula cells. Excel-style cell formulas live inside the table. Compute net scores, indices, point differences from neighbouring cells — without exporting to Excel.
Why it's fast
The engine is written in Rust and compiled to WebAssembly. Survey datasets are stored in a columnar layout with content-addressable column storage (so multiple datasets reuse identical columns) and residency is managed against your browser's available memory. The critical paths — group-by, filter, weight, sig test — are tight numerical code, not glue around an interpreter.
On a typical laptop, a crosstab on a 48,000-respondent survey (over 20 million data points across 425 variables) returns in under half a second. There is no progress bar to stare at.
See it on real data
The homepage has a live, working canvas with two demo datasets loaded.